
How to Build a LinkedIn Dashboard That Proves Your Social ROI
- 3 days ago
- 4 min read
In today’s digital marketing world, one question keeps coming up in boardrooms and marketing meetings alike: “What is the actual return on our social media efforts?”
For many marketers, LinkedIn has become one of the most important platforms for brand building, lead generation, and thought leadership. In fact, studies show that LinkedIn is responsible for a significant share of B2B social media leads, making it a critical platform for businesses looking to build professional credibility and attract potential customers.
Yet despite its importance, many teams struggle to prove the real value of LinkedIn marketing. Metrics like likes, impressions, and comments look impressive on reports, but they rarely convince decision-makers that social media is delivering tangible business results.
This is where a LinkedIn dashboard becomes essential.
A well-designed dashboard helps marketers connect LinkedIn activity with meaningful outcomes such as website traffic, qualified leads, and revenue. Instead of guessing what works, businesses can rely on data to understand how their content and campaigns are performing.
Understanding Social ROI on LinkedIn
Before building a dashboard, it is important to understand what social media ROI actually means.
Social ROI refers to the value a business generates from the resources invested in social media activities. These resources can include time spent creating content, money spent on advertising, and the cost of marketing tools or teams.
The most widely used formula for calculating ROI is:
ROI = (Return – Investment) ÷ Investment
For example, if a company spends ₹50,000 on LinkedIn campaigns and generates ₹1,50,000 in sales from leads that originated on LinkedIn, the return is significantly higher than the investment.
However, measuring LinkedIn ROI is not always straightforward. Unlike direct sales channels, social media often plays a role in earlier stages of the customer journey, such as awareness, trust building, and education. A potential customer may discover a brand on LinkedIn, read several posts, visit the website later, and only convert weeks or months afterward.
Because of this longer journey, businesses need a structured system that captures how LinkedIn contributes to the overall marketing funnel. A dashboard provides exactly that.
Why a LinkedIn Dashboard Matters
LinkedIn offers built-in analytics through company pages and campaign managers. These tools provide insights into follower growth, content engagement, and visitor demographics.
While useful, these insights alone do not paint the full picture. They often remain disconnected from broader marketing data such as website performance, lead generation, or revenue.
A LinkedIn dashboard solves this problem by bringing different data points together in one place. It allows marketers to track performance over time, compare campaigns, and connect social media efforts with measurable business results.
Instead of simply reporting numbers, marketers can identify patterns, understand what content resonates with their audience, and refine their strategy accordingly.
Start With Clear Marketing Goals
Every effective dashboard begins with a clear understanding of what success looks like.Without defined objectives, dashboards quickly become cluttered with dozens of metrics that do not actually help businesses make better decisions.
Most LinkedIn strategies typically focus on one or more of the following goals:
Increasing brand awareness
Driving website traffic
Generating leads
Establishing thought leadership
Supporting sales teams with warm prospects
Each of these goals requires different metrics. For example, if the objective is brand awareness, metrics such as impressions, reach, and follower growth are useful indicators. If the goal is lead generation, marketers should instead focus on link clicks, landing page visits, and form submissions.The key is to ensure that every metric on the dashboard connects directly to a marketing objective.
Focus on Metrics That Actually Matter
One of the most common mistakes in social media reporting is focusing on vanity metrics. Numbers like likes or impressions may appear impressive, but they rarely translate directly into business impact.
To build a meaningful LinkedIn dashboard, it is helpful to organize metrics into three levels: awareness, engagement, and conversion.
Awareness Metrics
Awareness metrics measure how many people are discovering your brand. These indicators help marketers understand whether their content is reaching a broader audience.
Examples include impressions, reach, follower growth, and page views. While these metrics do not prove revenue directly, they help determine whether the brand’s visibility is increasing over time.
Engagement Metrics
Engagement metrics show how audiences interact with content. On LinkedIn, engagement includes reactions, comments, shares, and clicks.
A strong engagement rate often indicates that the content is relevant and valuable to the audience. Posts that generate conversation or sharing typically have a higher chance of reaching new audiences organically.
Monitoring engagement patterns can help marketers identify the types of content that resonate most with their target audience.
Conversion Metrics
Conversion metrics are the most important indicators of social ROI. These metrics connect LinkedIn activity to actual business outcomes.
Examples include website visits from LinkedIn, newsletter sign-ups, demo requests, event registrations, or sales inquiries.
Tracking these metrics usually requires tools like website analytics platforms, UTM tracking links, and CRM systems. Once these systems are connected, marketers can see exactly how LinkedIn contributes to lead generation and revenue.
Structuring an Effective LinkedIn Dashboard
A good dashboard should tell a story. Instead of presenting random numbers, it should guide viewers through the performance of LinkedIn marketing efforts.
A simple and effective dashboard structure typically includes three sections.
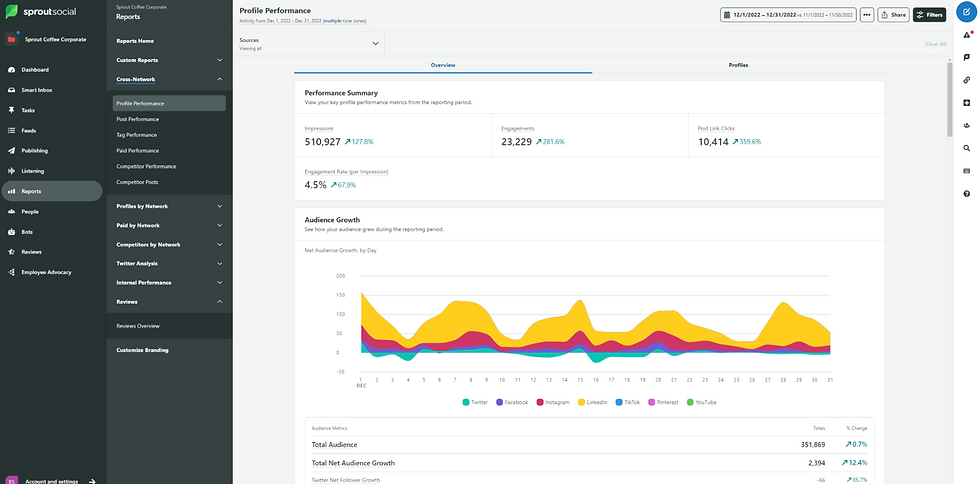
The first section provides a high-level overview of LinkedIn performance. This snapshot might include total impressions, engagement rate, follower growth, and total clicks generated during a specific time period.
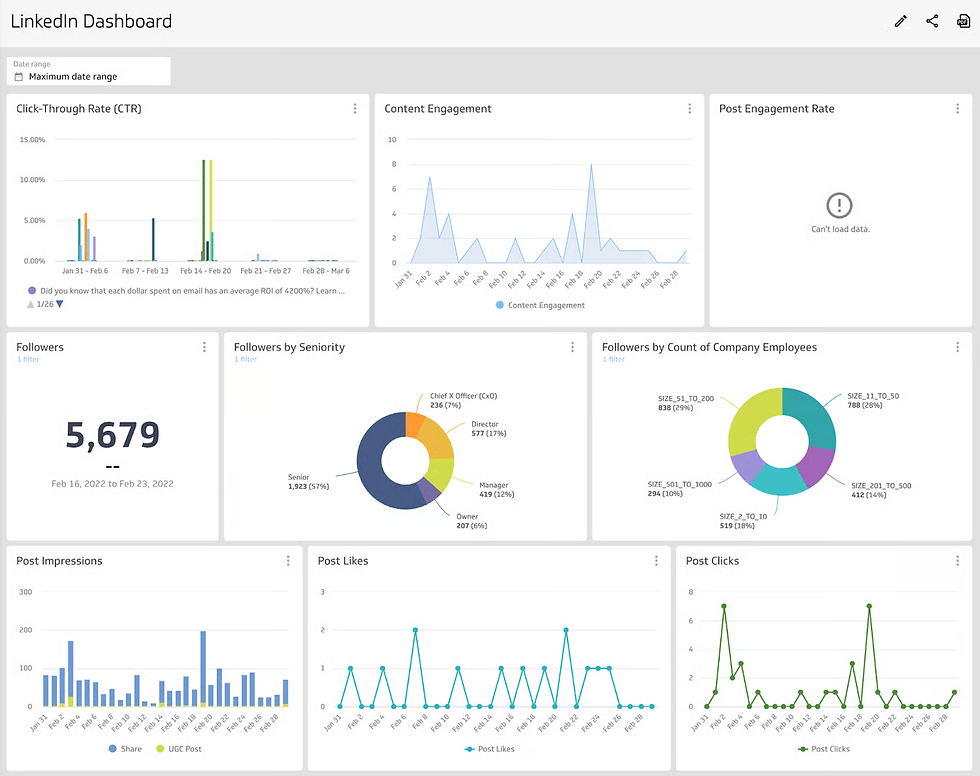
The second section focuses on content performance. This part highlights which posts performed best, which formats generated the most engagement, and which topics drove the most clicks. By analyzing these trends, marketers can identify patterns that inform future content strategies.
The third section focuses on business impact. This is where the dashboard proves its value. Metrics such as leads generated, conversion rates, cost per lead, and revenue influenced by LinkedIn campaigns demonstrate the platform’s contribution to broader business goals.
When stakeholders see this connection clearly, LinkedIn marketing becomes easier to justify and expand.
Turning Insights Into Strategy
The real value of a LinkedIn dashboard lies not just in measuring performance but in improving strategy. By analyzing how content and campaigns perform, marketers can identify what works and refine their approach. If certain posts drive strong engagement, similar formats can be repeated. If impressions are high but conversions are low, the issue may lie in weak calls-to-action or landing pages.
Over time, this cycle of measuring, learning, and optimizing helps businesses maximize the impact of their LinkedIn presence. A well-structured dashboard connects social media activity with real business outcomes, turning LinkedIn from a simple posting platform into a data-driven growth channel.


Comments